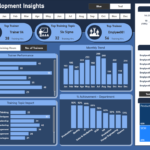
Sales Distribution Dashboard in Excel and Power BI
We are about to demonstrate to you how to create a fully interactive sales distribution dashboard in Microsoft Excel & Power BI. Using the same database, as well as similar dashboards created in Microsoft Excel & Power BI that have almost the same visuals. Basically, these are designed for businesses that do business in a B2B environment.
There are a total of 20 minutes and 55 seconds in this YouTube video that demonstrate a complete dashboard in Excel that can be created by following these steps:
- Overview of the Dashboard
- Overview of the Datasheets
- Prepare the Database
- Insert Pivot Tables
- Add the Dashboard Background
- Create Visuals & Format it
There are a total of 26 minutes and 23 seconds in this YouTube video that demonstrate a complete
sales distribution dashboard in Power BI that can be created by following these steps:
- Import data to Power BI
- Edit Data in Power Query Editor
- Create Visuals
- Format Visuals & Background
- Format Dashboard Theme
In addition to this, you will learn to change the complete theme of the dashboard by just selecting the standard theme color or the customized one.