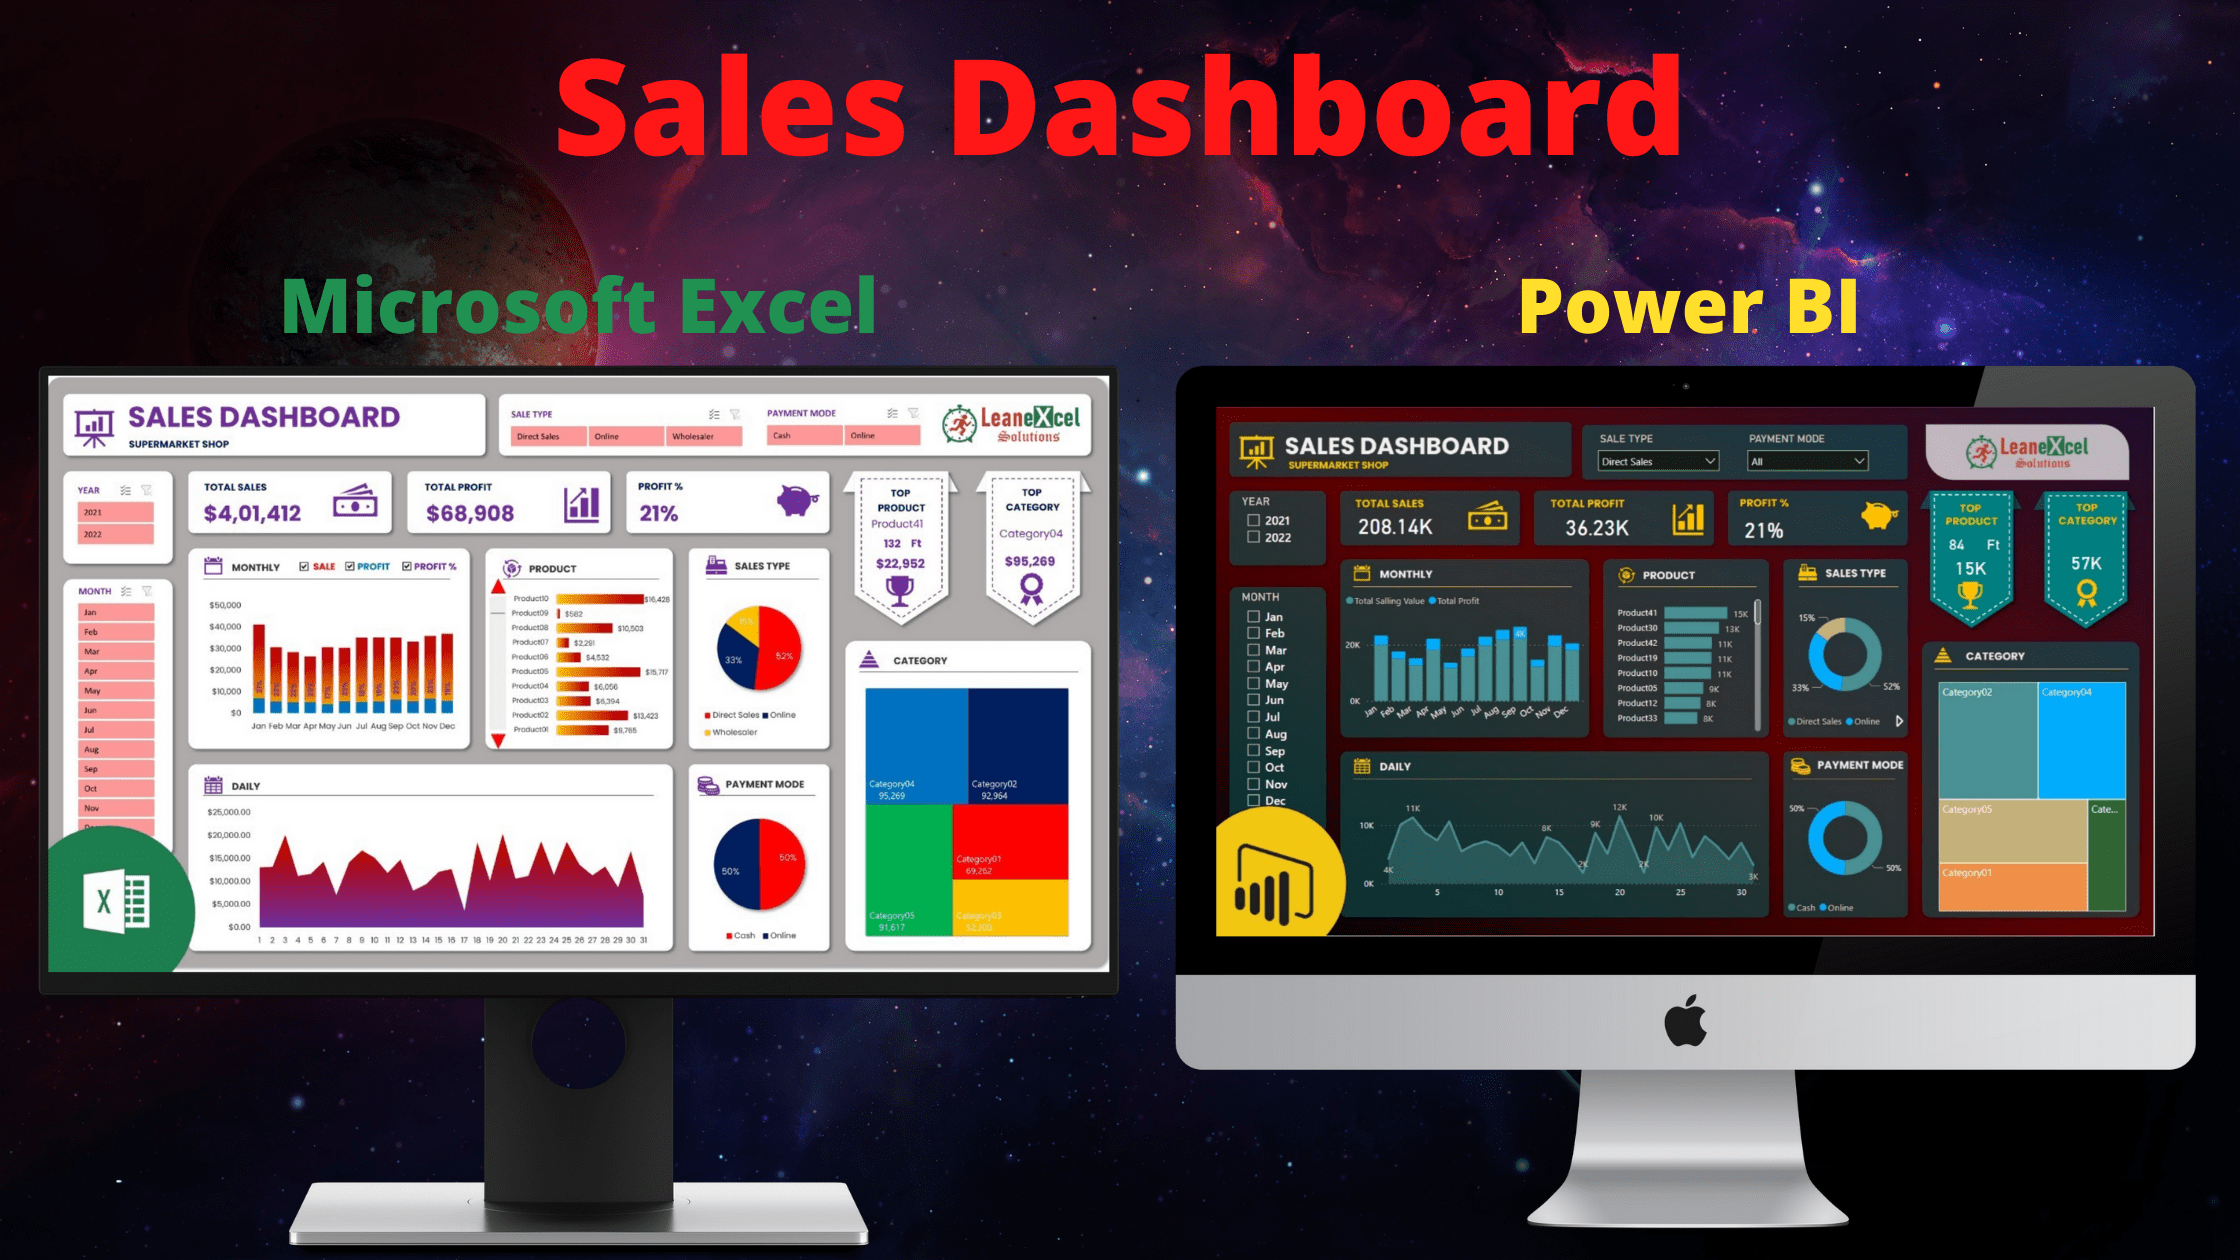
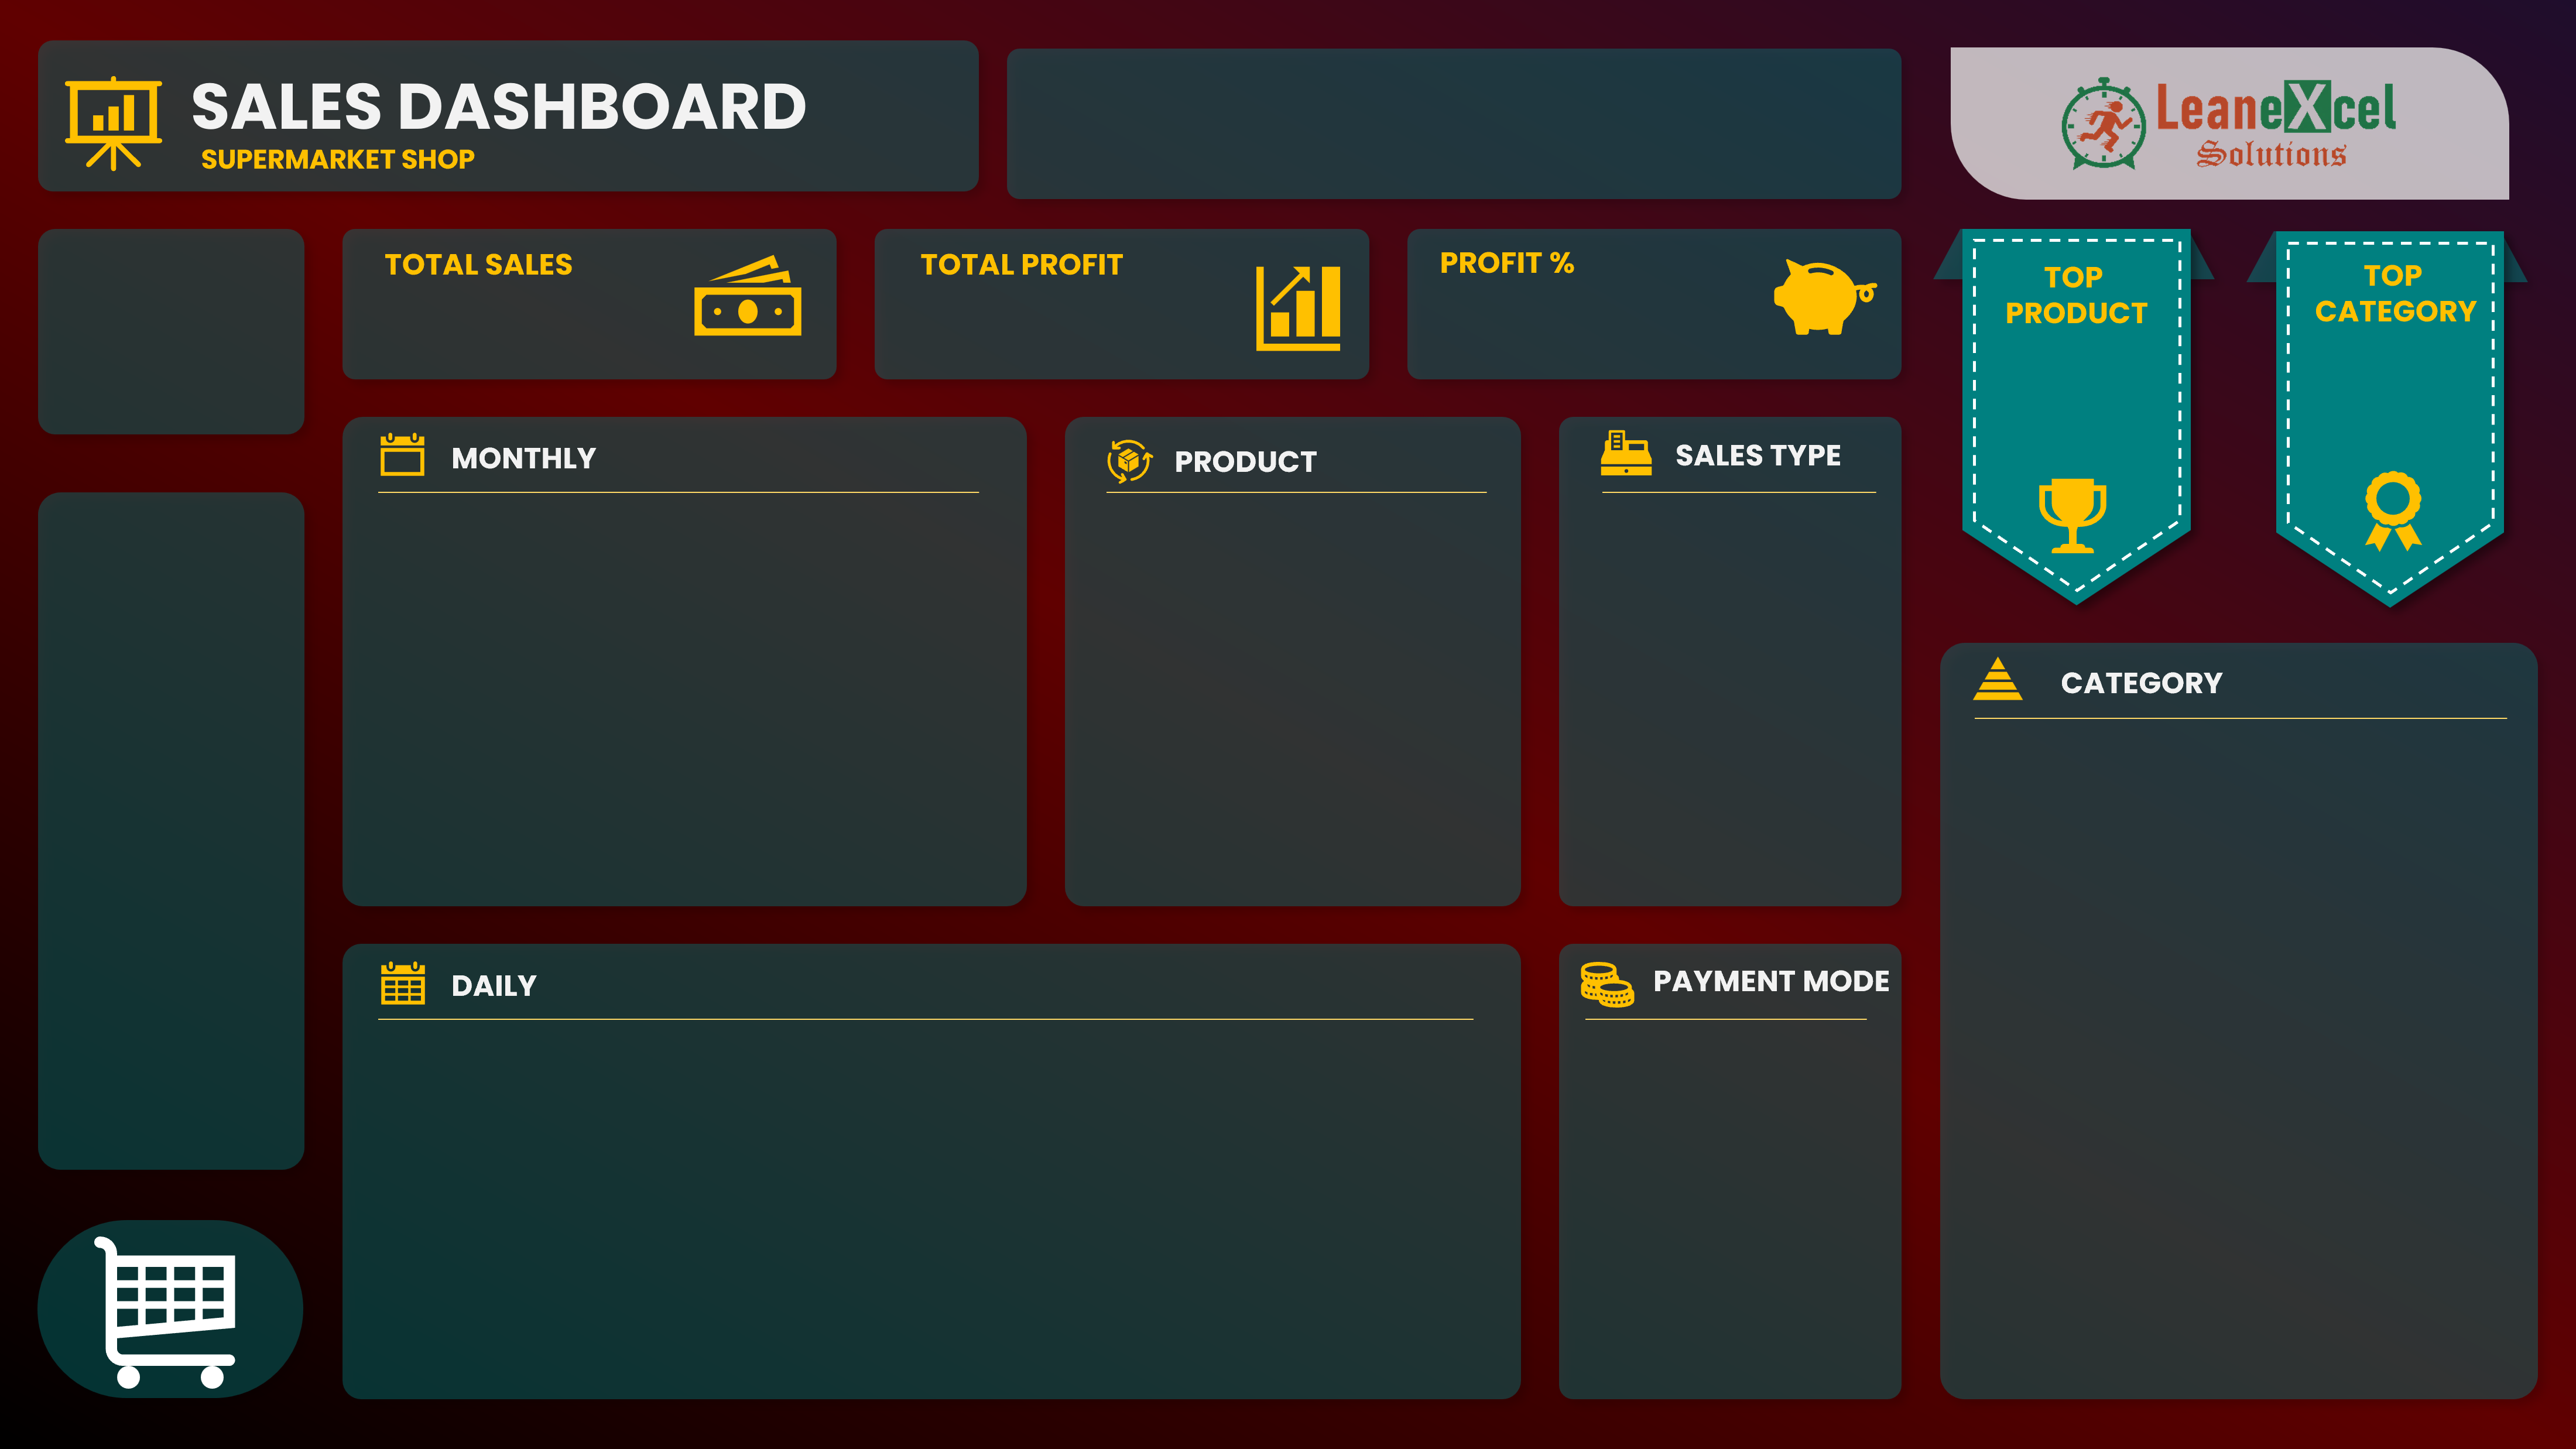
Sales Dashboard in Excel and Power BI
We are about to demonstrate to you how to create a fully interactive sales dashboard in Microsoft Excel & Power BI. We will use the same database, and create similar dashboards in Microsoft Excel & Power BI that look almost identical. In general, these are designed to cater to the needs of businesses involved in B2C transactions.
There are a total of 43 minutes and 52 seconds in this YouTube video that demonstrate a complete sales dashboard in Excel that can be created by following these steps:
- Dashboard Overview
- Datasheets Overview
- Prepare Database
- Analyze and Prepare Visuals
- Design Background
- Design Dashboard
- Format Visuals
In addition to this, you will learn to change the complete theme of the dashboard by just selecting the standard theme color or the customized one.
There are a total of 16 minutes and 22 seconds in this YouTube video that demonstrate a complete
sales dashboard in Power BI that can be created by following these steps:
- Import data to Power BI
- Edit Data in Power Query Editor
- Create Columns & measures
- Create Visuals
- Format Dashboard Background
- Format Visuals

please I need the fdata file for please i need to practice
You should be a part of a contest for one of the most useful sites on the web. I will highly recommend this website!