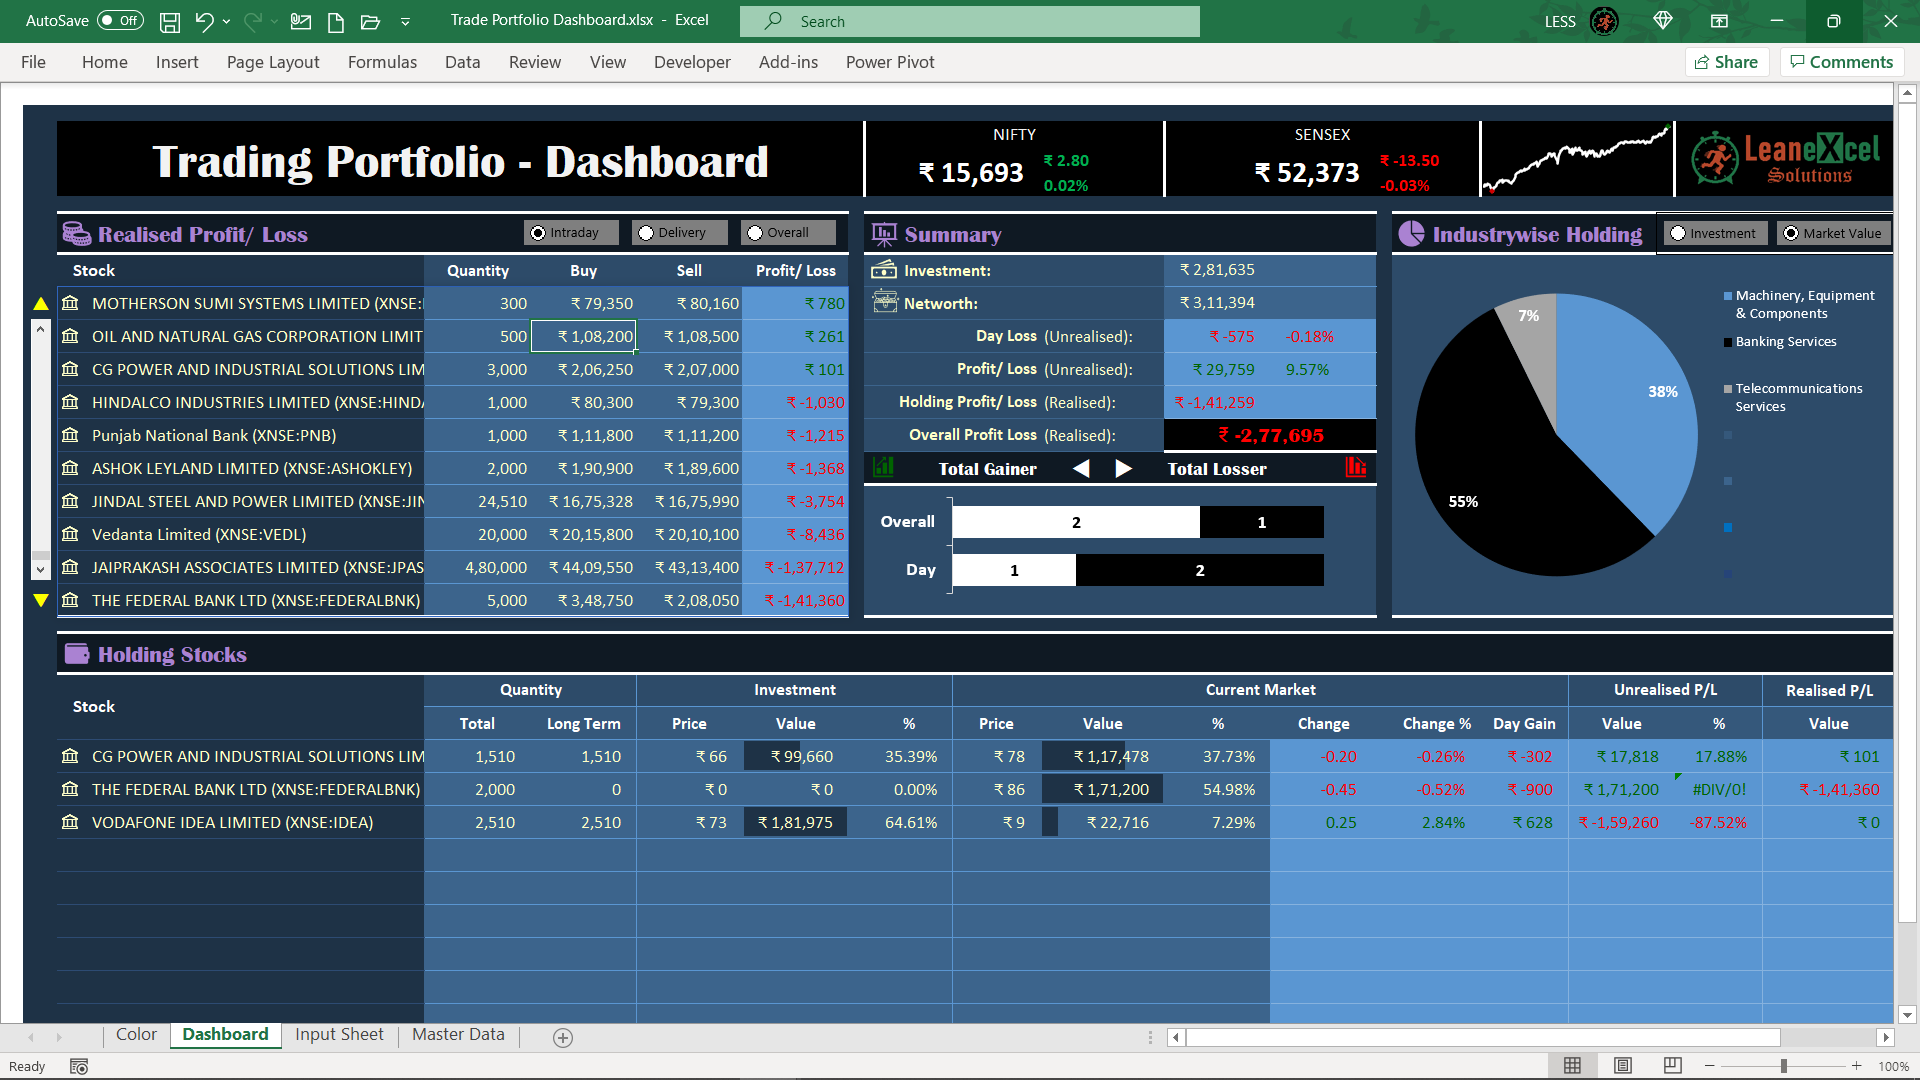
Trading Portfolio Dashboard
Create your Own Trading Portfolio Dashboard in Microsoft Excel with the help of 4 tutorials.
This Dashboard is completely dynamic, you need to refresh to get the current updated status.
During the tutorials, you will not only learn the designing Dashboard but also some of the important “Excel functions and tools”, such as:
Excel Functions:
- IF(), SUMIF(), SUMIFS(). AVERAGEIF(), AVERAGEIFS()
- OFFSET()
- INDEX() & MATCH()
- SORT(), UNIQUE(), FILTER()
- STOCKHISTORY() etc.
Excel Tools:
- Stocks
- Name Manager
- Form Controls like Scroll Bar, Option Buttons
- Spark Lines
- Formatting. and Conditional Formatting
The first part is about an overview of the dashboard.
It gives an overview of all visuals in the dashboard, and what else you will learn while designing the dashboard.
The second part is about designing the layout of the dashboard, that is the background of the dashboard.
It includes an overview of theme colors, font type & size for heading & text body, etc.
And designing the complete layout of the trading portfolio dashboard.
The third part is about preparing a master database which is a back-end calculation to prepare a database.
In this part, you will learn various excel functions and tools in detail.
The fourth part is about visualizing the dashboard by integrating the layout and the database prepared in the second and third parts.
Note: The file will work with the Office 365 – Excel version, since the few functions are not available with earlier Excel versions.