


Description
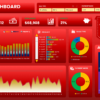
📊 Sales Dashboard in Microsoft Excel
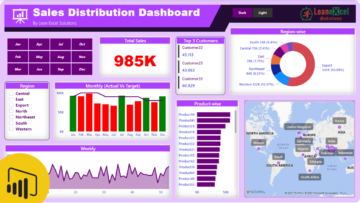
Presenting the Fully Interactive Sales Dashboard for Microsoft Excel — a powerful and easy-to-use template
that helps businesses monitor and analyze sales data efficiently.
Designed for retail and B2C organizations such as supermarkets, online stores, or distributors,
this dashboard enables data-driven decision-making and simplifies sales performance tracking.
✨ Overview:
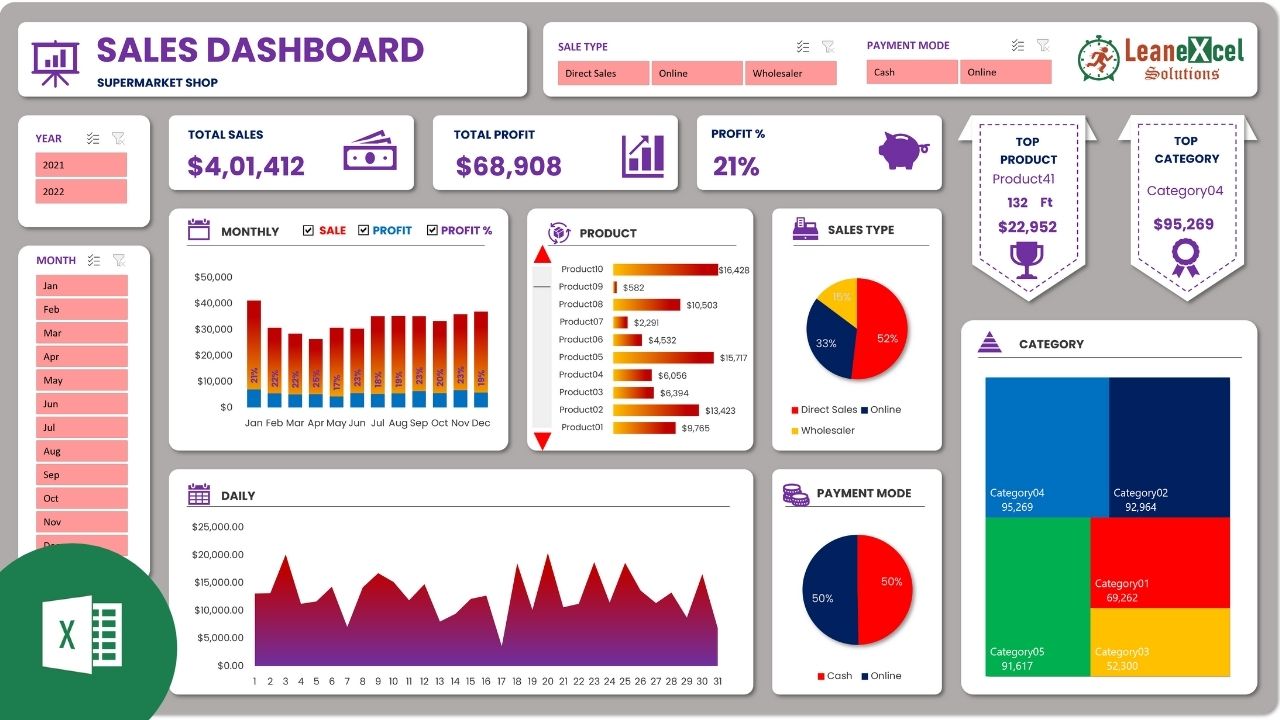
This professional Excel dashboard transforms sales data into interactive visuals and key performance metrics.
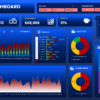
It features a responsive layout, scrollable charts, category breakdowns, and one-click theme customization —
all built with native Excel functions and Pivot logic.
The template is fully editable and adaptable to any business size or structure.
💡 Key Features:
- 📈 Interactive Dashboard: Analyze sales by year, month, sales type, and payment mode using dynamic slicers.
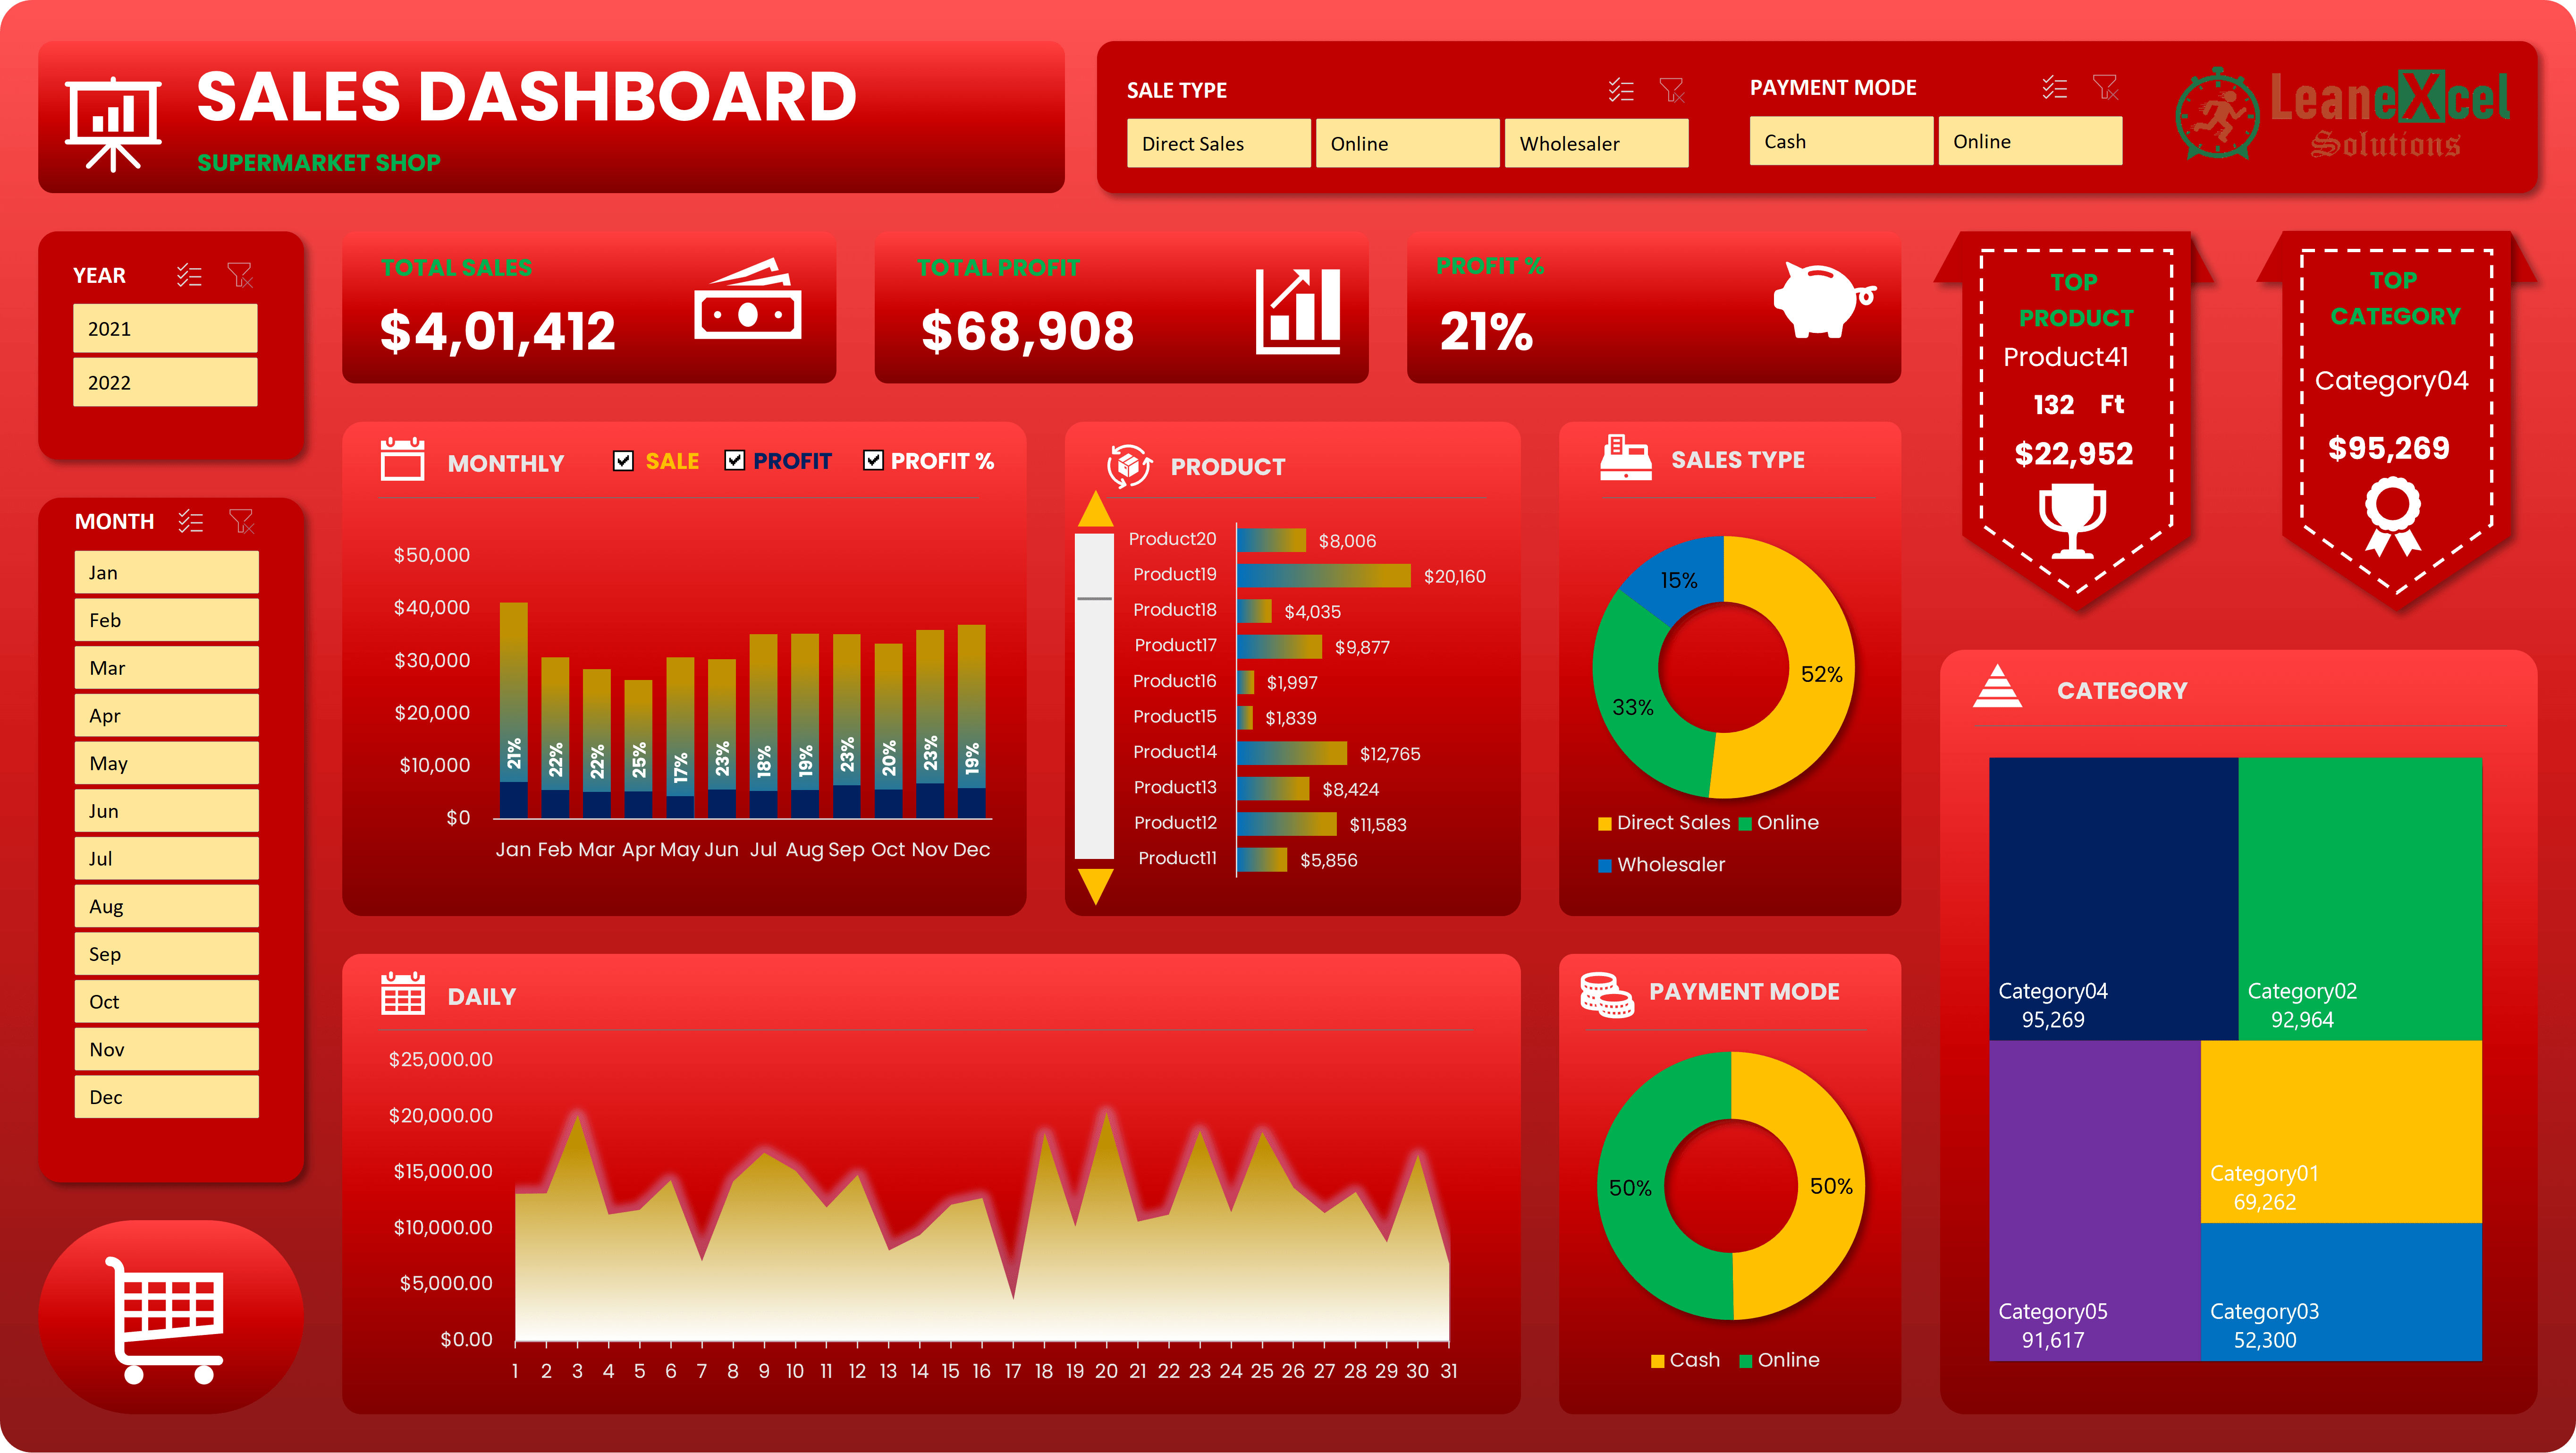
- 🎨 One-Click Theme Switch: Instantly change the entire dashboard color scheme by selecting a standard or custom theme.
- 📊 Dynamic Visuals: Includes scrollable top-product charts, category breakdowns, and sales contribution visuals.
- 🧾 Structured Data Model: Master and input sheets with predefined fields for easy data entry and maintenance.
- 🪄 Dual Background Options: Choose between plain or gradient backgrounds designed in PowerPoint for professional presentation.
- 💰 Automatic Calculations: Pre-built formulas compute total sales, profit, and profit percentage instantly.
- 🧩 Customizable Colors: Modify the dashboard theme using the included color guideline sheet to match your brand style.
We demonstrate this product on our
YouTube channel.
You can preview the dashboard setup and interactivity in the
official video demonstration
before making your purchase.
📁 What’s Included:
After completing your purchase, you’ll receive a download link to a Microsoft Excel workbook containing the following sheets:
- 📊 Dashboard: The main visualization layer featuring KPIs, charts, and summary insights.
- 🧾 Input Data: Sheet for daily or periodic sales entry with linked formulas and pivots.
- 📦 Master Data: Product catalog with product IDs, names, categories, and pricing details.
- 📈 Analysis: Backend calculations and pivot tables powering dashboard visuals.
- 🎨 Color Guideline: Reference for color codes to customize the dashboard’s theme and layout.
⚙️ Key Functionalities:
- 🔗 Linked slicers for real-time filtering across visuals.
- 📅 Month-wise and category-wise performance tracking.
- 📊 Scrollable product sales view for detailed analysis.
- 🌈 Theme-based visual customization (Standard or Custom colors).
- 💾 Auto-refreshing pivot calculations for up-to-date reporting.
⚙️ Compatibility:
- 🖥️ Developed in Microsoft Excel Office 365.
- 💡 Compatible with Excel 2019 or later (supports slicers and pivot features).
- ⚙️ 100% built using native Excel formulas — no macros or add-ins required.
🔒 Licensing:
Licensed for personal or business use within your organization. Redistribution or resale in any form is not allowed.
📘 Important Notes:
- ✔️ Created using Excel Office 365 for full compatibility with theme and formatting features.
- 🔁 Click “Refresh All” after every data update to refresh visuals.
- 💾 Always back up your workbook to prevent data loss.
- 📧 For any download-related issues, contact
info@leanexcelsolutions.com
or use the
Contact Form. - 📖 Blog Reference:
Sales Dashboard in Excel and Power BI. - 🎥 Watch Demo:
Sales Dashboard in Excel | Interactive Product Demonstration.
💡 Tip: Always select colors from Excel’s Theme Colors to ensure smooth one-click theme switching.

Reviews
There are no reviews yet.