

Description
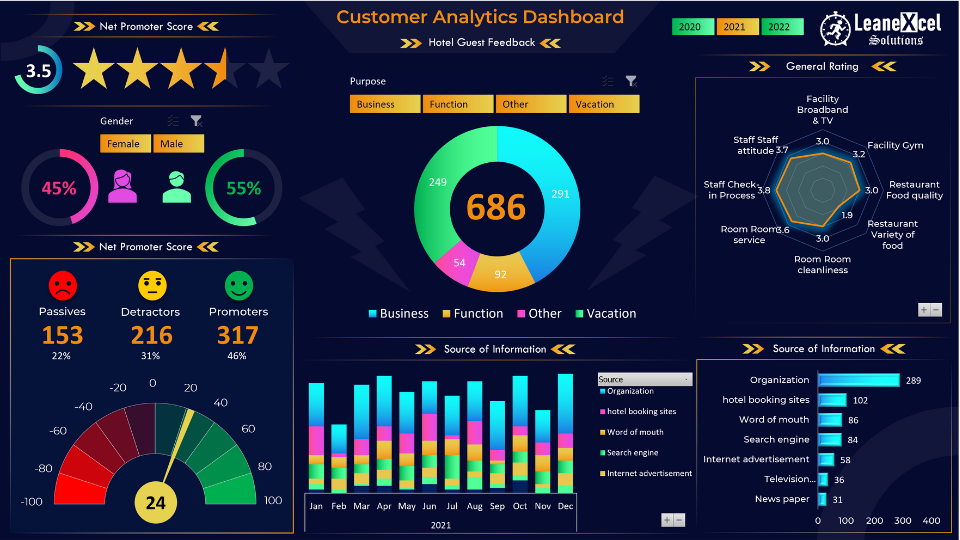
Customer Analytics Dashboard in Microsoft Excel
Introducing our Customer Analytics Dashboard for Excel – a powerful tool designed to help businesses gain valuable insights from customer feedback. This interactive dashboard is perfect for analyzing survey data collected through Microsoft Forms or Google Forms, allowing you to make data-driven decisions with ease.
With this dashboard, you can effortlessly transform raw survey data into meaningful visualizations and metrics. The user-friendly interface, coupled with the seamless integration of Power Query and PowerPivot, makes data transformation and analysis a breeze. No more manual input or tedious data manipulation – our dashboard automates the process for you.
We demonstrate this product on our YouTube channel as-is. It is recommended that you watch the complete tutorials before making a purchase.
Upon purchase, you can download the Microsoft Excel file, which contains 5 sheets.
- Dashboard: The epicenter of visuals. A beautifully crafted, interactive dashboard presenting the key metrics at a glance.
- Analysis: Delve into details. This sheet harbors pivot tables and performs backend calculations to support the dashboard visuals.
- Input Data: Your primary data reservoir. Feed in customer feedback, and watch the dashboard come to life.
- Ref: Reference table for feedback categories and rating ranges
- Guideline: Theme colors and guidelines for refreshing the data
Note:
- After payment, if you have difficulty downloading the file, please write to info@leanexcelsolutions.com or use the Contact Form.
- Watch the YouTube Tutorials:

Jamesina Deluga –
Jamesina Deluga
Verlina Gerek –
Verlina Gerek