


Description
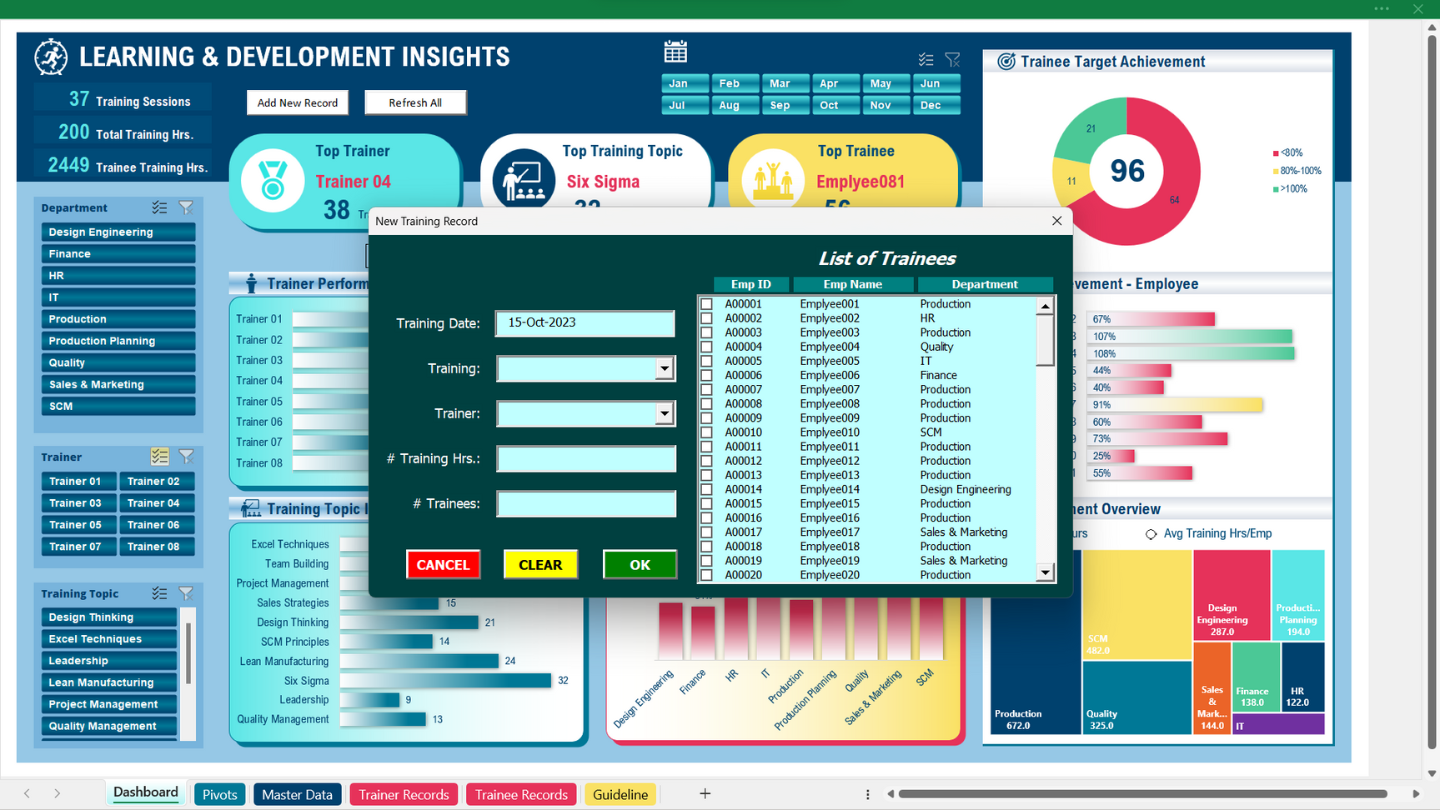
📊 Learning and Development Insights Dashboard in Excel
Elevate your Learning and Development (L&D) initiatives with this meticulously designed Excel dashboard template.
Perfect for HR professionals, L&D managers, and trainers, this dashboard delivers comprehensive insights, visual summaries, and
interactive filtering. As a result, you can easily analyze and present training data in a professional, data-driven format.
✨ Key Features:
- 🎨 Visual Excellence: Enjoy color-coded metrics, interactive charts, and an intuitive layout that makes insights clear and engaging.
- 🔍 Dynamic Filtering with Slicers: Effortlessly drill down into specific months, trainers, topics, or departments for detailed analysis.
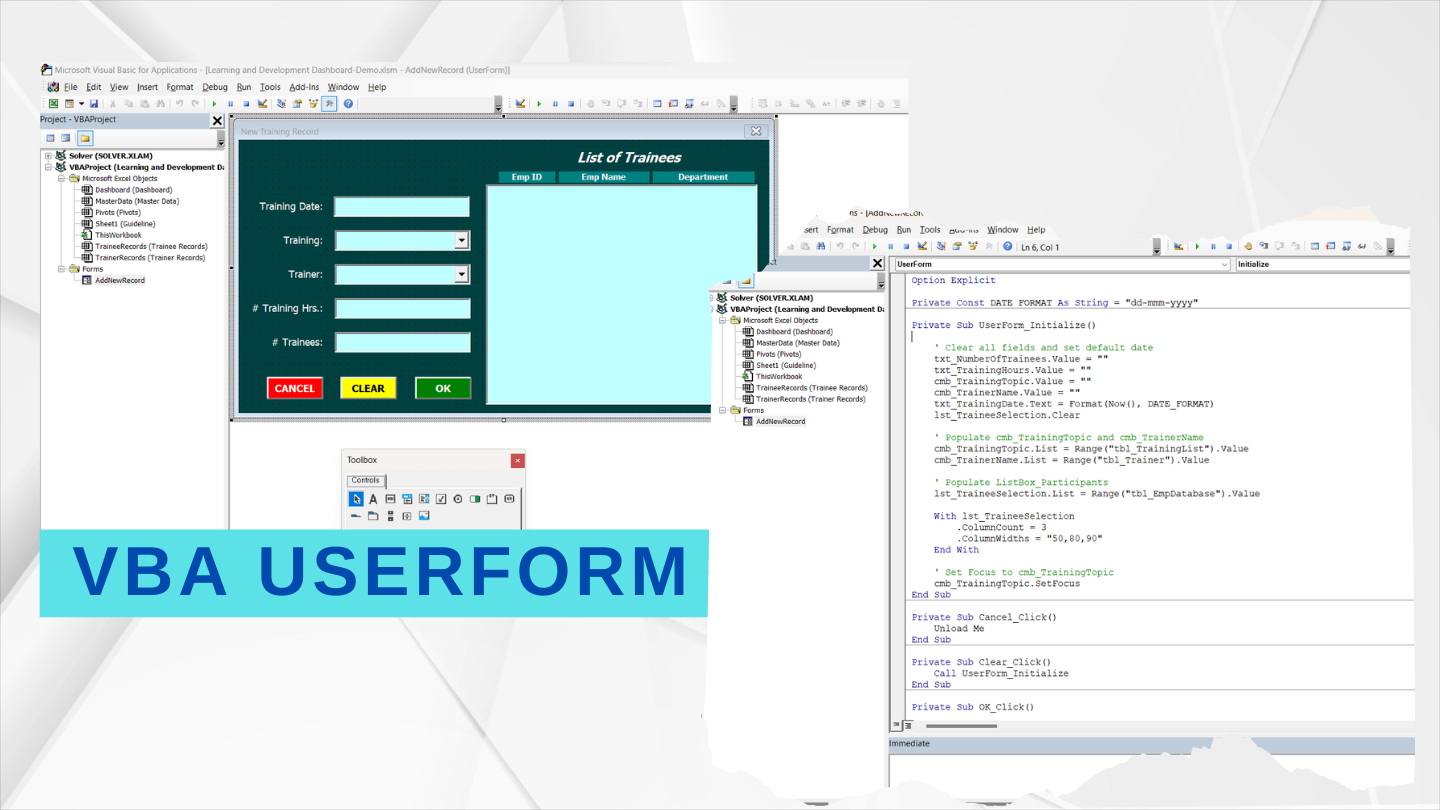
- ⚙️ VBA-Integrated UserForm (Optional): Simplify data entry using a friendly form interface—no need to handle raw spreadsheets directly.
- 🧾 Alternative Non-VBA Version: Additionally, a manual-input version is included for users who prefer working without macros.
- 💻 Responsive Design: Whether you’re presenting in a boardroom, working from a desktop, or analyzing on-the-go, the design remains crisp, clear, and functional.
- 🎨 Fully Customizable: Adapt the template’s visuals, color themes, and KPIs to suit your organization’s unique requirements.
We showcase this dashboard on our
YouTube channel.
Therefore, we recommend watching the
complete tutorial before purchasing.
This helps you understand setup, data flow, and customization options clearly.
📦 Upon Purchase:
Once your purchase is complete, you will receive a secure download link.
This link gives access to a .zip file containing all required files and documentation.
- 📘 2 Excel Files:
- ✅ One version equipped with VBA for automated data handling and dynamic input.
- 🧩 Another version without VBA for manual entry, perfect for those who prefer simplicity.
- 📄 1 Text File: Includes the VBA code for reference or customization, helping advanced users explore the automation logic.
📑 Each Excel File Includes 6 Sheets:
- 📊 Dashboard: Provides visual summaries and key metrics for quick insights.
- 📈 Pivots: Contains pivot tables that generate interactive visuals and charts.
- 🗂️ Master Data: The central hub for structured input and processed analytical data.
- 👨🏫 Trainer Record: Dedicated sheet to capture trainer-related data.
- 👩🎓 Trainee Records: Captures all trainee data with relevant attributes.
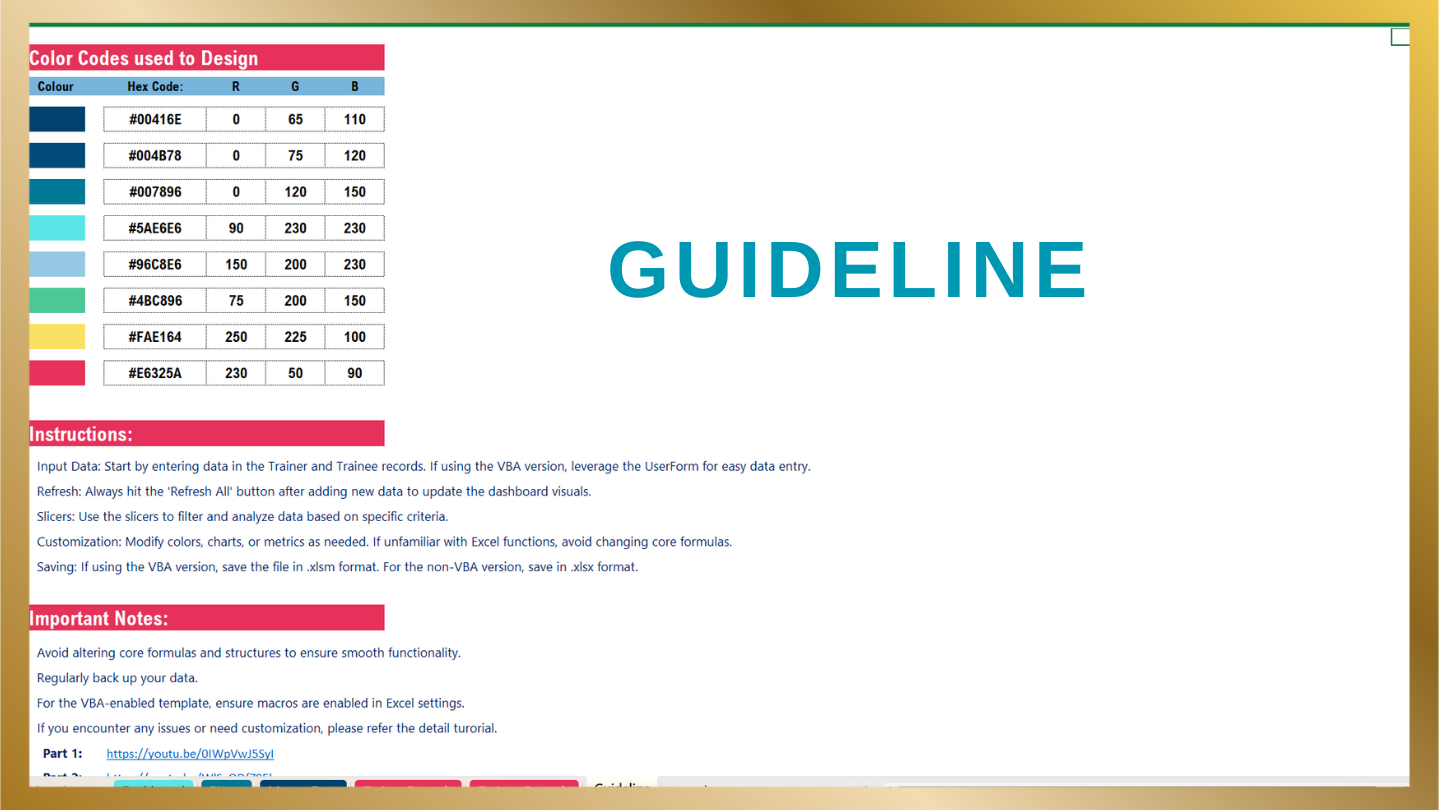
- 📘 Guideline: Step-by-step instructions to ensure smooth setup and use.
🧭 Instructions for Use:
- 📥 Input Data: Start by entering data into the Trainer and Trainee records.
If using the VBA version, utilize the UserForm for faster data entry. - 🔄 Refresh: After entering new data, click Refresh All to update dashboard visuals.
- 🧩 Slicers: Use the slicers to filter and analyze data by trainer, topic, department, or month.
- 🎨 Customization: Modify visuals, colors, or metrics as needed. However, avoid changing core formulas unless you are familiar with Excel logic.
- 💾 Saving: Save the VBA-enabled file as .xlsm and the non-VBA version as .xlsx to maintain functionality.
⚠️ Important Notes:
- 🔒 Avoid modifying or deleting essential formulas and structures to ensure smooth performance.
- 💾 Regularly back up your files to prevent data loss.
- ⚙️ For VBA-enabled templates, ensure that macros are enabled in Excel’s settings before use.
- 📧 If you face download issues post-payment, contact
info@leanexcelsolutions.com
or reach us through the Contact Form. - 🎥 Watch the YouTube Tutorials:
🎓 Tip: Watching the tutorials first will help you maximize dashboard performance and avoid setup errors.
Furthermore, you’ll learn how to expand this dashboard for multi-year or multi-department analysis with ease.
Reviews
There are no reviews yet.