Introduction:
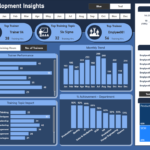
The Learning & Development Insights Dashboard is your one-stop solution for a comprehensive view of organizational training metrics. Crafted meticulously in Excel, this dashboard offers a visual representation of training sessions, attendance, performance, and more. The goal? To streamline the decision-making process for HR professionals, training managers, and anyone keen on improving organizational learning.
Key Features of the Development Insights Dashboard:
- Dynamic Visualization: Easily grasp your training metrics through interactive charts and graphs, ensuring data-driven decision-making at a glance.
- Customizable Data Inputs: Whether you’re adding trainer records or trainee details, our dashboard ensures a seamless update process.
- Pivot Table Analysis: Explore a deeper layer of your data. Our pivot tables provide a comprehensive breakdown of essential training metrics, letting you dive into the specifics.
- Dynamic Slicers: Customize your data view! Our slicers allow quick filtering by categories such as month, trainer, training topic, or department.
- Intuitive and Aesthetic Design: Combining user-friendly navigation with a modern design palette, our dashboard ensures both ease of use and visual appeal.
- VBA and Non-VBA Flexibility: Whether you’re a VBA enthusiast keen on using the integrated UserForm or someone who leans toward manual data entry, we have both options available.
- Comprehensive Coverage: Beyond just numbers, we encapsulate the entire spectrum of training metrics, from gauging trainer effectiveness to understanding departmental training adherence.
Dive Deeper with our YouTube Tutorials:
For those keen on a deep dive, we’ve curated a series of YouTube videos detailing every facet of our L&D dashboard.
Part 1- Dashboard Overview & Data Entry:
Kick off your journey into the Learning & Development Insights Dashboard with this tutorial. This segment lays the groundwork by guiding you through the Dashboard’s overview, Input data sheets setup, and the intricacies of UserForms design. Delve into VBA code integration, validation processes, and more. By the end of this part, you’ll have a robust foundation, ready for the advanced features covered in Part 2.
Part 2 - Power Pivot & Advanced Analytics:
Elevate your dashboard skills with the continuation of our Learning & Development Insights Dashboard series. In this tutorial, we dive deep into Power Pivot, Data Transformation, and data visualization techniques. Master the art of adding and interconnecting pivot tables, extracting crucial data, and designing eye-catching visual elements. Whether you’re a VBA enthusiast or someone looking for standard Excel functionalities, this segment has something for everyone.