Introduction:
Welcome to our comprehensive guide on creating dynamic and interactive Sunburst charts in Excel! Whether you’re an Excel novice or a seasoned pro, this tutorial will help you visualize hierarchical data in a visually compelling way.
Understanding Sunburst Charts:
What is a Sunburst Chart?
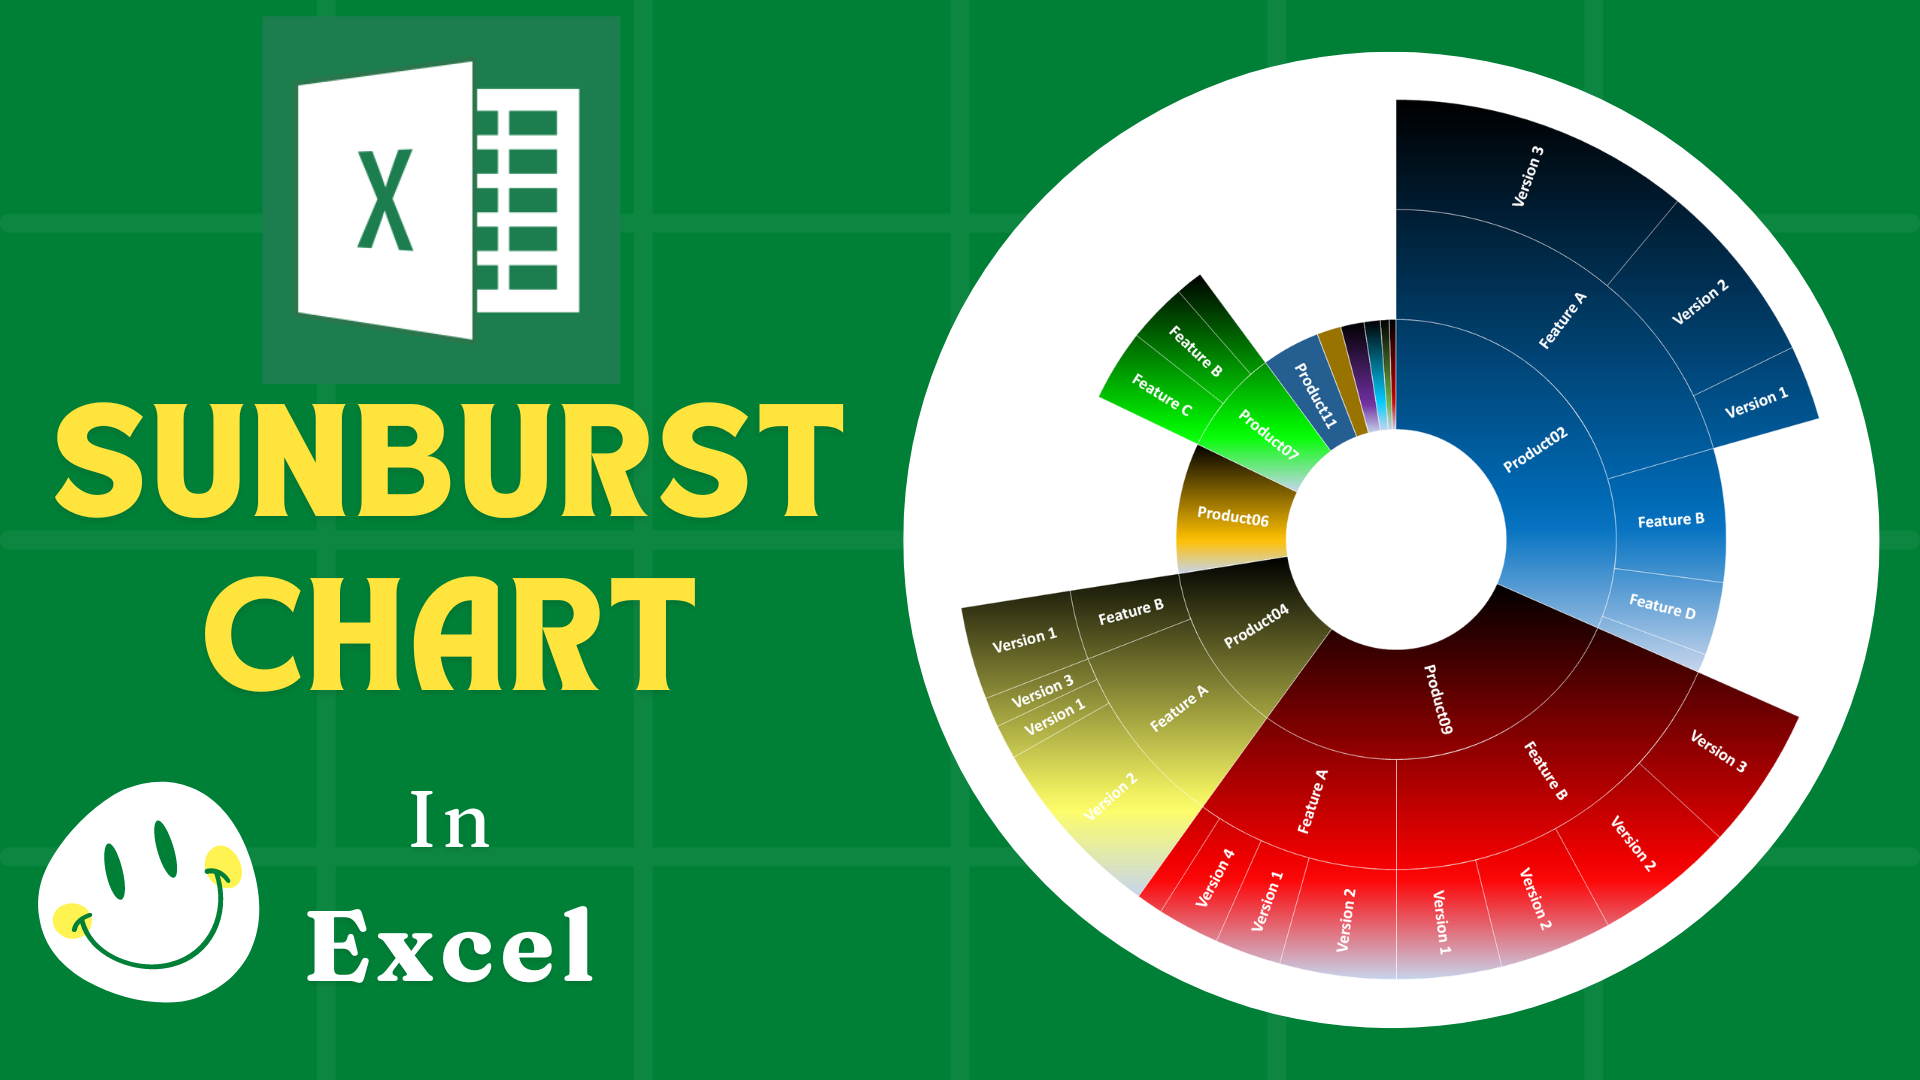
A Sunburst chart is a powerful visualization tool used to represent hierarchical data. It displays data in a circular layout with multiple levels, where each level is represented by a ring or circle. The innermost circle represents the top-level data, and each subsequent ring represents a deeper level of the hierarchy. Each segment’s size is proportional to its value, providing a clear visual comparison between different parts of the hierarchy.
Benefits of Sunburst Charts
- Visual Clarity: Offers a clear representation of complex hierarchical data.
- Interactive Exploration: Many Sunburst charts are interactive, allowing you to drill down into deeper levels for more detailed insights.
- Proportional Representation: The size of each segment is proportional to its value, making it easy to compare different parts of the hierarchy.
Applications of Sunburst Charts
- Market Segmentation: Representing different market segments, customer demographics, and their subcategories.
- Sales Data: Representing sales data by region, product category, and individual products.
- Product Categories: Visualizing product categories, subcategories, and individual products.
- File System Hierarchy: Displaying the structure of directories and files on a computer or server.
- Geographical Data: Visualizing data by continent, country, region, and city.
Dive Deeper with our YouTube Tutorials:
To get a visual and detailed step-by-step guide, be sure to watch our YouTube video tutorial. By following these steps, you can create a dynamic and interactive Sunburst chart in Excel that updates automatically with your data. This powerful visualization tool will help you gain insights into your hierarchical data at a glance.

