


Description
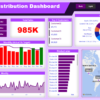
📦 Sales Distribution Dashboard in Power BI
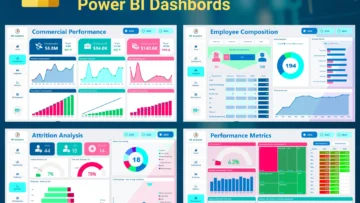
Learn, customize, and analyze your business performance with this fully interactive Sales Distribution Dashboard in Power BI.
Designed for business professionals, analysts, and Power BI learners, this dashboard not only helps you track sales by region and product
but also teaches you how to build and theme your own dashboard — step by step.
✨ Overview:
This dashboard template is built to demonstrate professional-level design and functionality using Power BI’s native tools.
Moreover, you’ll learn how to import, clean, and model data, create visuals, and apply advanced formatting.
Most importantly, you can toggle between light and dark themes with a single click — a unique feature included in this dashboard.
💡 Key Highlights:
- 📊 Step-by-Step Dashboard Creation: Learn how to import data, model relationships, and create impactful visuals.
- 🎨 One-Click Theme Switch: Instantly toggle between Light and Dark themes using a theme slicer.
- 📈 Dynamic Sales Analysis: Explore regional, product, and customer-level insights with interactive visuals.
- 🧮 Built-In DAX Measures: Predefined measures for sales, target comparison, and visual formatting.
- 🌍 Map & Trend Visuals: Region-wise sales distribution, top customers, and sales performance trends.
- 💻 Professional Formatting: Includes background templates, icons, and a polished layout ready for presentation.
📦 What You’ll Receive:
Upon purchase, you’ll receive a .zip file containing all the files you need to use or recreate this dashboard.
- 📊 Sales Distribution Dashboard.pbix: Power BI Dashboard file featuring visuals, measures, and theme-switch slicer.
- 📘 Sales Distribution.xlsx: Excel input file for Power BI — including Sales, Target, and Customer datasets.
- 📗 Guideline.pdf: Step-by-step guide explaining how to integrate and refresh the Excel input file in Power BI.
📚 What You’ll Learn:
- 📥 Import and clean data using Power Query Editor.
- 🔗 Build data relationships and model structure automatically.
- 📈 Create interactive visuals (cards, charts, slicers, and maps).
- 🎨 Format dashboards with custom backgrounds and icons.
- 🌗 Apply one-click Light/Dark theme toggle using DAX and conditional formatting.
- ⚙️ Use DAX measures for color logic and target-based performance visuals.
⚙️ Compatibility:
- 🖥️ Works with Windows Power BI Desktop (Version 2.144.679.0 – June 2025 tested)
- 📊 Requires Excel 2016 or later (for structured input data)
- 🔁 Fully supports Power Query, DAX measures, and visual theme switching
🔗 Related Dashboard:
A similar Sales Distribution Dashboard with the same data structure is available in
Microsoft Excel.
Check it out if you prefer working in Excel.
📘 Important Notes:
- If you face issues downloading the file after purchase, contact us at
info@leanexcelsolutions.com
or use the Contact Form. - Read our detailed guide:
Sales Distribution Dashboard in Excel and Power BI. - Watch the tutorial videos:
🎥 Tip: Watch the tutorial before setup to understand how to link input sheets, apply conditional formatting, and toggle dashboard themes dynamically.


Reviews
There are no reviews yet.