
Description
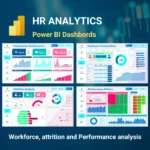
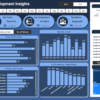
Learning and Development Insights Dashboard in Power BI
Transform your HR analytics with our advanced Learning and Development Dashboard, now available in Power BI.
Designed for HR professionals, L&D managers, and training coordinators, this dashboard helps you convert raw learning data into actionable insights.
As a result, you can make smarter decisions, evaluate training effectiveness, and strengthen organizational learning strategies.
✅ Features:
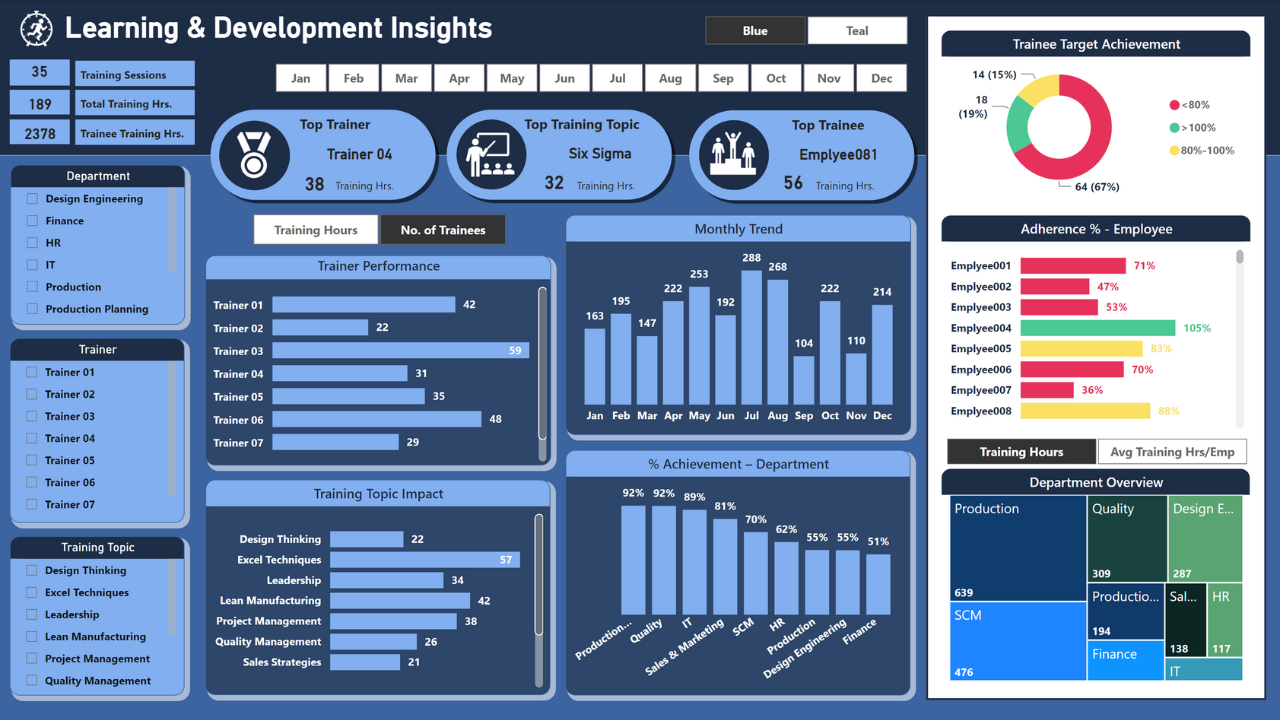
- Advanced Visualization: Experience modern data representation with Power BI’s dynamic charts, graphs, and visual elements.
These visuals provide clear and effective training insights that enhance your analysis. - Interactive Data Exploration: Additionally, leverage powerful slicers and filters for detailed exploration.
You can easily navigate through training data by months, trainers, topics, or departments to discover patterns and trends. - Seamless Integration: Moreover, import and transform diverse datasets efficiently.
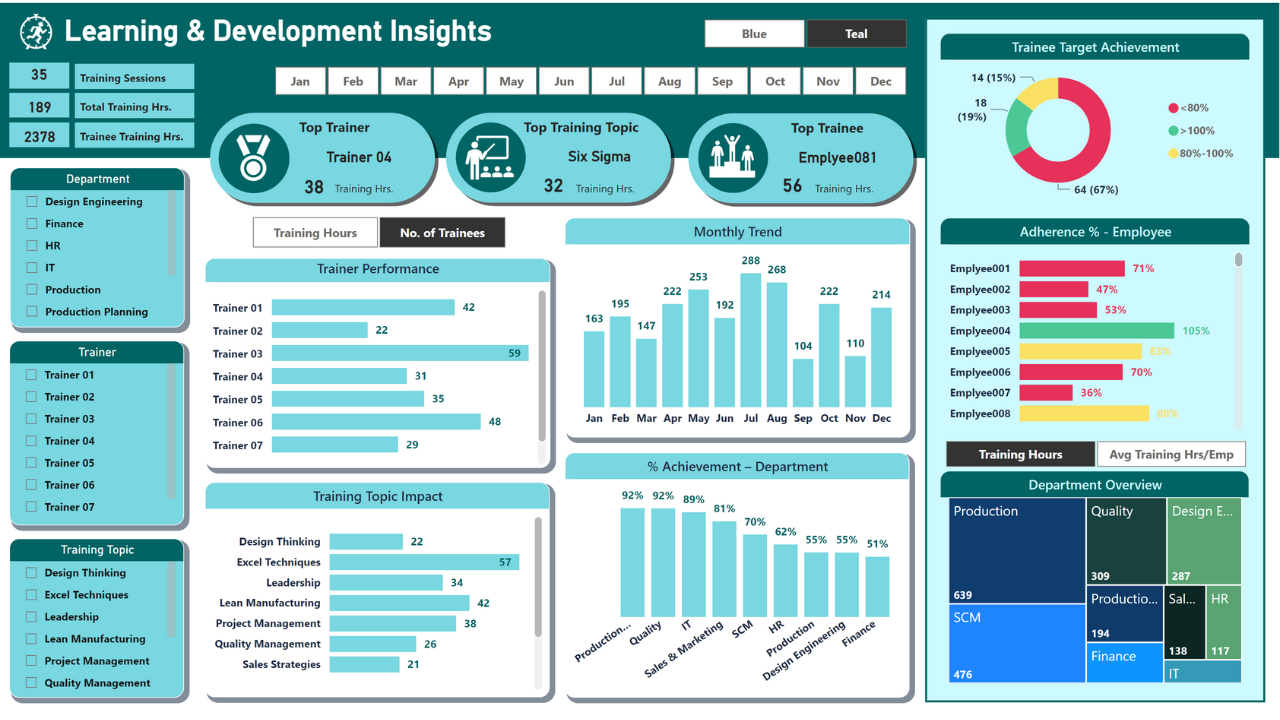
The dashboard simplifies complex data structures, making your reports easy to update and maintain. - Customizable Themes: Personalize the dashboard to align with your organization’s branding or departmental needs.
This customization enhances user engagement and ensures brand consistency. - Responsive and Intuitive Design: Whether you are presenting to leadership, working from a desktop, or reviewing results on a tablet,
the dashboard delivers seamless performance across all devices. - Comprehensive Coverage: Finally, gain a holistic view of your training programs — covering metrics such as trainer effectiveness,
attendance trends, learning hours, and departmental completion rates.
We showcase this product on our
YouTube channel.
Therefore, it is highly recommended to watch the
complete tutorial before making your purchase.
This ensures you understand the dashboard’s functionality and integration process.
📦 Upon Purchase:
Once your purchase is complete, you will receive a secure download link.
This link provides access to a .zip file containing the following resources:
- L&D Insights Dashboard.pbix: Power BI Dashboard file containing pre-built visuals and data queries.
- L&D Insights Dashboard.xlsx: Input file in Excel format for seamless Power BI data connection.
- Guideline.pdf: Step-by-step integration guide for connecting Excel input files with the Power BI dashboard.
- Icon Images: A folder containing all icons used in the dashboard visuals for customization and visual enhancement.
💡 Key Insights Covered:
- 📊 Training Performance: Analyze course completion rates, trainer performance, and learning hours.
- 👥 Participant Engagement: Track attendance, satisfaction scores, and participation levels.
- 🏢 Departmental Insights: Compare training results across departments and job roles.
- 📈 Learning Trends: Identify skill development progress and emerging learning priorities.
⚙️ Compatibility:
- 🖥️ Works on Windows Power BI Desktop (tested on version 2.144.679.0 – June 2025)
- 📊 Requires Excel 2016 or later (structured tables preferred)
- ⚙️ Enable “New Card Visual” and “Button Slicer Visual” preview features in Power BI
🔒 Licensing:
This template is licensed for personal or business use within your organization.
Redistribution, resale, or external sharing is strictly prohibited.
📘 Important Notes:
- Ensure familiarity with Power BI for optimal use. Avoid modifying key data models or visuals unless necessary.
- Regularly back up your Excel input files and Power BI dashboard for safety.
- If you face download issues post-payment, contact info@leanexcelsolutions.com
or use the Contact Form. - Read the detailed article: Empowering Insights with Power BI: The Comprehensive Learning & Development Dashboard.
- Watch our YouTube tutorial: Power BI Dashboard Creation – Step-by-Step for Learning & Development.
🎥 For setup assistance and visual demonstration, visit our
YouTube Channel
and explore detailed walkthrough videos.

Reviews
There are no reviews yet.